This is a kind of exploration of some ideas I worked on a while ago as part of my research, and have only just come back to, in order to tidy them up a bit. I’m putting it online as a way – perhaps – to get some comments/criticism, and also to enable me to refer to it, if necessary, in future blog posts. If I’m honest, classifications and taxonomies fatigue me quite a lot; coming up with ideas and making and testing them is a lot more fun. But sometimes they’re useful. I hope this one is.
If we think about how products are used, it’s clear that changes can result from the products themselves changing, users changing their behaviour, or a combination of both.
At the University of Bath, Ed Elias, Elies Dekoninck and Steve Culley [1] have captured these possibilities with a 2 × 2 matrix (Figure 1), in which ‘new products’ and ‘old products’ are compared with ‘new user behaviour’ and ‘old user behaviour’.
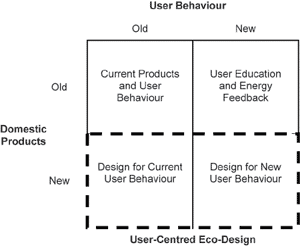
Along these lines, it’s possible to consider technology change (via design) and attitude change (via education) as two routes to achieve overall behaviour change. Especially in the sustainable design field, the emphasis is often on one strategy or the other, even though the routes are by no means mutually exclusive, as the ‘Design for New User Behaviour’ title implies in the matrix.
Loughborough’s Debra Lilley, Vicky Lofthouse and Tracy Bhamra [2] describe three ‘solutions to limit socially and environmentally undesirable behaviours’: Educational intervention — which corresponds closely to attitude change; Technological intervention — corresponding to technology change; and Product-led intervention — closely aligned with Elias et al’s Design for New User Behaviour.
Further consideration of the possibilities in this area, and how to represent them, led me to the development of a ‘Behaviour Change Barometer’. This diagram attempts to illustrate somewhat more nuanced ‘cases’ of behaviour change, and which factors are present or absent in each case. It ought to be applicable to many kinds of behaviour change with products, not just environmentally-related ones; equally, read ‘products/services/systems’ for ‘products’ to allow wider applicability. The barometer metaphor is stretched slightly, but it seemed appropriate given that the diagram’s mapping change.
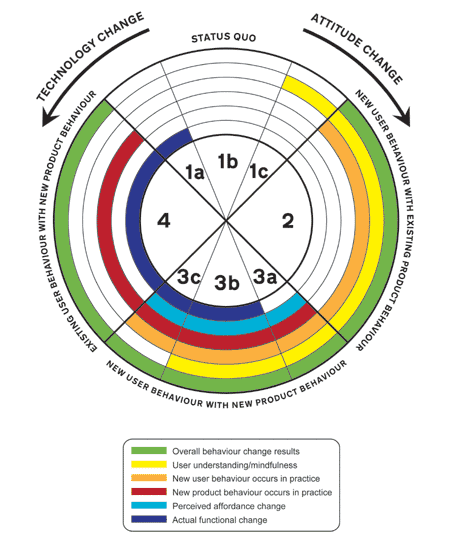
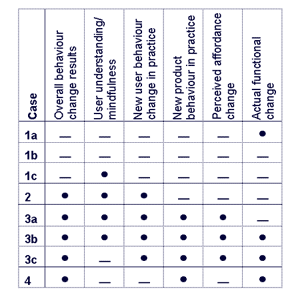 The same information is presented in tabular form here: in essence, there are six variables involved, with the possibility space divided into quadrants.
The focus of my research is on the intersection of technology change and attitude change (Quadrant 3): the design of products (and systems) which, through new product behaviour, change user behaviour. Quadrant 3 will be discussed last here — before that, it’s useful to run through the other quadrants briefly.
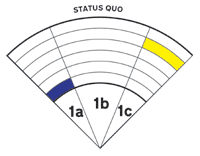 Quadrant 1: Status quo
In the first quadrant, no overall behaviour change results.
It makes sense to describe case 1b first — this is the absolute ‘no change’ case, where there is no change in the actual functions of the products (they might be new products, but they don’t do anything different to the old products), people use them in the same way they did before, and users have no understanding or mindfulness of the issues around behaviour change.
Case 1a describes situations where the products’ functions have been changed, but users make no use of this, and have no understanding or mindfulness of the issues involved (e.g. a washing machine offers a new ‘eco’ mode alongside the other settings, but a user doesn’t use it). Therefore no overall behaviour change results, despite product improvement.
In 1c, users have an understanding of the issues, and may be mindful of their behaviour and its impacts, but nevertheless don’t change what they do, and continue to use products in the same way as before — e.g. someone who knows that leaving a television on standby wastes electricity, but doesn’t act on this understanding. Again, no overall behaviour change results, despite improved user understanding.
This quadrant encompasses much current behaviour with energy-using consumer products — improved education and improved technology have raised awareness of environmental issues, and allowed products to be operated more efficiently, but if users don’t act accordingly, there will be no overall change in behaviour.
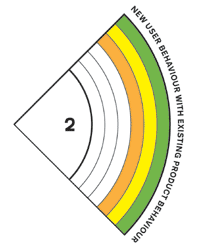 Quadrant 2: New user behaviour with existing products
Educating users about the implications of their behaviour is generally done with the intention that users will follow through and actually change the way they use products (if they don’t change, this is 1c as described above). If this is successful — e.g. a campaign to persuade people to keep their car tyres inflated correctly to save fuel — then new user behaviour occurs with existing products, and no design or engineering changes are needed to the products. Overall, there is a change in behaviour.
The scope of this quadrant corresponds closely with much current government policy of using social marketing, public education campaigns and so on — employing persuasion and rhetoric to drive attitude change as a foundation for behaviour change. There are many ways that this quadrant could be subdivided into behavioural cases, but from the point of view of the current study, this won’t be explored further here.
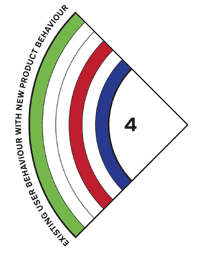 Quadrant 4: Existing user behaviour with new product behaviour
Where new products themselves behave differently in use, yet allow users to maintain their existing behaviours, overall behaviour change results without users necessarily needing to understand the issues involved. No persuasion occurs. For example, compact fluorescent lightbulbs, from the user’s point of view, do not require any different user behaviour to tungsten filament bulbs, but in operation they always result in new product behaviour. A refrigerator door which automatically closes itself if left ajar does not, again, require the user to do anything different, but the product itself behaves differently to accommodate existing user behaviour.
This quadrant would include the major proportion of ‘eco-products’ available, most of which are designed to allow the user to change routines and behaviours as little as possible; there are many possible ways the category can be subdivided further according to various other factors.
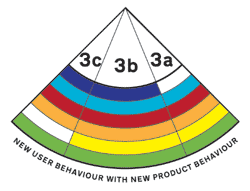 Quadrant 3: New user behaviour with new product behaviour
In the cases described by this quadrant, both product behaviour and user behaviour change, resulting in an overall behaviour change. The behaviour change can be driven entirely by functional changes to the product, or by mindful user understanding, or by both, but the products are designed to lead to this. This is Design with Intent.
These are products that persuade, guide or force — influence — users to change the way they interact with them. A common factor is that there is a perceived affordance change with the product: it somehow indicates that a change in behaviour is needed (compared with quadrant 4 where there is no such indication). This quadrant is where my research is focused.
In case 3a, the perceived affordance change does not reflect actual functional change to the product, yet it influences users to change their behaviour. For example, a washing machine which gives users an ‘estimated cost’ for each mode still embodies all the same functions as one which doesn’t — the user can choose to ignore the recommendation, but is influenced to choose the most economical mode, and thus a change in product behaviour is likely to result from the change in user behaviour. This is where much of the Persuasive Technology research seems to fit.
3c is the case where a user need not think about the issues involved, but will still behave differently due to functional changes to the product — e.g. a washing machine which automatically determines the most efficient settings for a particular load, and silently carries them out, doesn’t require the user to understand what’s going on, but does end up changing the user’s behaviour (removing inefficient decisions) and thus the product behaviour changes too. These products have the potential to be complex, especially where automation is required, but need not be. Something as simple as removing an option from a menu changes the user’s behaviour (prevents him or her choosing it) but doesn’t require the user to think about it.
Finally, returning to the centre of the quadrant, 3b describes cases where user understanding, alongside functional changes to the product and perceived affordance change, lead to user and product behaviour change in practice: these are the real core of what this study is about and where, I hope, I’ll be able to make advances in understanding useful to designers and anyone else working in the field of influencing user behaviour. These are interesting products, potentially involving lots of factors and effects but not necessarily complex in themselves.
[1] Elias, E W A, Dekoninck, E A, Culley, S J. The Potential for Domestic Energy Savings through Assessing User Behaviour and Changes in Design. EcoDesign2007, 5th International Symposium on Environmentally Conscious Design and Inverse Manufacturing, Tokyo, 2007
[2] Lilley, D, Lofthouse, V, Bhamra, T. Towards Instinctive Sustainable Product Use. 2nd International Conference: Sustainability Creating the Culture, Aberdeen, 2005. Available here [PDF].